Click image to enlarge and read.

Check the Clues - Pollen Diagrams
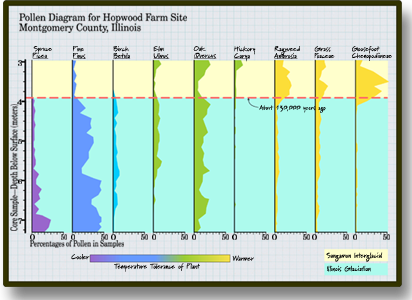
At the Changes Institute, we studied the pollen in the lake sediments. We created this diagram to show which plants were living here at different periods in time. Can you use this information to interpret the changes in climate that took place?
What Does the Pollen Record Show?
Here is what the scientist said:
" When I look at the pollen diagram from the Hopwood Farm site, here’s what I see. Prior to 130,000 years ago, during the Illinois glaciation, spruce, pine, birch, elm, and oak grew in this area. Today, these trees occur together in the cooler climate of northern Minnesota, Wisconsin, and Michigan. So…during the time when they lived together in Illinois, it must have been cooler."